
When it comes to financial magic, the government of the United States takes the prize. Sleights of hand and clever distractions by purveyors of line-of-credit mortgages, living benefit variable annuities and equity indexed life insurance that I have illustrated in recent weeks are clumsy parlor tricks compared to the Big Magic of American politicians.
Consider the proud trumpeting that came from Washington at the close of the 2007 fiscal year. The deficit for the unified budget was, they crowed, down to a mere $162.8 billion.
In fact, our government is overspending at a far greater rate. Total federal debt increased by $497 billion over the same period.
But politicians of both parties use happy numbers to distract us. Democrats routinely criticize the Republican administration for crippling deficits but they politely use the least damaging figure— the $162.8 billion. Why? Because references to more realistic accounting would reveal vastly greater numbers and implicate both parties.
You can understand how this is done by taking a close look at a single statement on federal finance from the President’s Council of Economic Advisors. The September statement shows that the “On-budget” ran a deficit of $344.3 billion in fiscal 2007. The “Off-budget” ran a surplus of $181.5 billion. (The Off-budget is dominated by Social Security, Medicare, and other programs with trust funds).
Add the two figures and you get the “Unified Budget” that $162.8 billion. In the last 8 years we’ve had two years of reported surpluses and six years of reported deficits. Altogether, the total reported deficit has run $1.3 trillion.
But if you examine another figure— gross federal debt— you’ll see something strange. First, it has increased in each of the last 8 years even though 2 of them reported surpluses. Second, gross federal debt (which includes the obligations held by the Social Security and Medicare trust funds) has increased much faster than the deficits— some $3.3 trillion over the same eight year period.
That’s $2 trillion more than the reported $1.3 trillion in deficits over the period.
Can you smell Enron?
In other words, while our reported deficits averaged $162.5 billion over the last 8 years, government debt increased an average of $412.5 billion a year. That’s more than twice as much.
How could this happen?
Easy. The Treasury department simply credits the Social Security, Medicare, and other trust funds with interest payments in the form of new Treasury obligations. No cash is actually paid. The Trust funds magically increase in value with a bookkeeping entry. It represents money the government “owes itself.”
So what happens if we take out the funny money?
When the imaginary interest payments are included, the Social Security and Medicare are running at a tranquilizing surplus (that $181.5 billion mentioned earlier). But measure actual cash and the surplus disappears.
In 2005, for instance, the Social Security Disability Income program started to run at a cash loss. This year, 2007, is the first year that Medicare part A (the hospital insurance program) benefits paid out exceeded income.
The same thing will happen to the Social Security retirement income program in 6 to 9 years, depending on which of the Trustee’s estimates you use. During the same period the expenses of Medicare Part B and Part D, which are paid out of general tax revenue, will be rising rapidly.
In spite of this, the Social Security Administration writes workers every year advising them that the program will have a problem 34 years from now, not 6 or 9 years. In fact, the real problem is already here. It will be a big-time problem in less than a decade.
Count on it.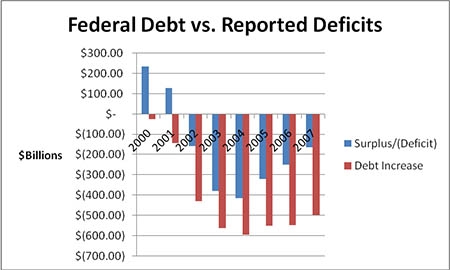
| Federal Debt vs. The Reported Deficit | ||||
| Total Federal Debt | ||||
| Year | Deficit | Debt Increase | End | Beginning |
|
2000 |
$ 236.20 | $ 23.20 | $ 5,628.70 | $5,605.50 |
|
2001 |
$ 128.20 | $ 141.20 | $ 5,769.90 | $5,628.70 |
|
2002 |
$ (157.80) | $ 428.50 | $ 6,198.40 | $5,769.90 |
|
2003 |
$ (377.60) | $ 561.60 | $ 6,760.00 | $6,198.40 |
|
2004 |
$ (412.70) | $ 594.70 | $ 7,354.70 | $6,760.00 |
|
2005 |
$ (318.30) | $ 550.60 | $ 7,905.30 | $7,354.70 |
|
2006 |
$ (248.20) | $ 546.10 | $ 8,451.40 | $7,905.30 |
|
2007 |
$ (162.80) | $ 497.10 | $ 8,948.50 | $8,451.40 |
| Source: Economic Indicators | ||||
On the web:
Economic Indicators, October:
http://www.gpoaccess.gov/indicators/07octbro.html
Statements for Social Security and Disability Income combined:
http://www.socialsecurity.gov/OACT/TR/TR07/VI_SRfyproj.html#wp185082
Sample letter from Social Security:
http://ssa.gov/mystatement/sample1.htm
Earlier columns on Social Security
http://assetbuilder.com/tags/Social+Security/default.aspx
Earlier columns in this series:
October 26, 2007: The Magic of a Tricky Mortgage
http://assetbuilder.com/blogs/scott_burns/archive/2007/10/26/the-magic-of-a-tricky-mortgage.aspx
November 4, 2007: A Simple Alternative to “Living Benefits”
http://assetbuilder.com/blogs/scott_burns/archive/2007/11/02/magic-in-finance-part-2-an-alternative-to-living-benefits.aspx
November 11, 2007: Equity Indexed Life Insurance— What You Are Not Told Is as Important as What You Are Told
http://assetbuilder.com/blogs/scott_burns/archive/2007/11/09/magic-in-finance-part-3-equity-indexed-life-insurance.aspx
This information is distributed for education purposes, and it is not to be construed as an offer, solicitation, recommendation, or endorsement of any particular security, product, or service.
Photo credit by Pixaby
(c) A. M. Universal, 2008